These puzzles involve creating various three-color images.
[M-15]
Write a program that creates an image
based on cosine waves.
For this image, all pixels in the same column will have
the same color.
Imagine the width of the image to be measured in
radians from 0 to 2*PI.
The column number of a pixel can be translated into
radians by the formula 2*M_PI*col/numColumns.
(M_PI is defined in math.h.)
Now this can be used with a cosine function so that
the amount of red varies horizontally over one full cycle:
red = 125 + 125*cos( 2*M_PI*col/numColumns );
The red value varies between 0 and 250. By itself, this results in the following image
 |
| One Full Cosine Cycle |
For more cycles across the width of the image, multiply the radian angle by the number of desired cycles:
red = 125 + 125*cos( redCycles*2*M_PI*col/numColumns );
If redCycles is three, this results in the following image:
 |
| Three Full Cosine Cycles |
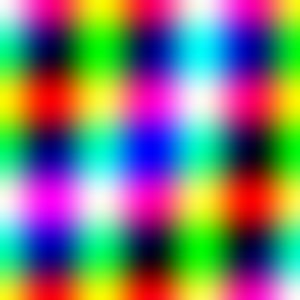
Similar calculations can be done for green and blue. Write a program where the user can specify the frequency for red, green, and blue on the command line:
C:\PuzzleFolder>colorWaves waves.ppm nrows ncols redCycles greenCycles blueCycles
Here is an example output image:
 |
| Color Waves |
For additional fun, you could allow the user to specify the number of cycles, the phase, and the magnitude of each wave. This would be 9 parameters for the colors, which might be more confusing than it is worth.
![]()
[M-15]
Write a program based on the previous program.
But now, imagine that horizontal, vertical, and diagonal
distances are all measured in radians.
The column number of a pixel can be translated into
radians as before.
The row number of a pixel can be translted into radians by
by the formula 2*M_PI*row/numRows.
The amount of green varies vertically by:
green = 125 + 125*cos( greenCycles*2*M_PI*row/numRows );
The distance from the upper left diagonal can also be converted into
radians.
Regard the upper left corner as zero radians, and the lower right corner as 2*M_PI
radians.
The length of the image diagonal can be calculated by the Pythagorean formula.
The distance of any pixel from the upper left corner can be calculated using the same formula.
Now the amount of blue for a pixel is:
blue = 125 + 125*cos( blueCycles*2*M_PI*dist/diagLength );
The user specifies the size of the image and the number of cycles for each color on the command line, as before. Here is an example image:
 |
| Waves and More Waves |
As a variation on this program, make the various waves all one color, perhaps red.
No answer has been provided for this puzzle.
[M-15]
Write a program that creates an image
based on cosine waves,
but now the cosine depends on the radial distance from the
center of the image.
For any pixel, think of it as lying on a line segment
that starts at the center of the image.
Measure distance along the line in radians from 0 to 2*PI, where
distance zero is the origin and distance 2*PI is the distance
from the origin to a corner.
(This works best if the image is square.)
For instance, in the diagram, pixel P lies on a line segment that starts at the center of the image and ends on a circle who's radius is half the diagonal size of the image. The distance of pixel P from the center, measured in radians, is
radians = 2*M_PI*(dist/radius)
where dist is the distance from the center
and radius is the length of the diagonal from the
center to a corner of the image.
The dist is calculated using the usual Pythagorean formula
based on the row and column number of P.
The amount of red for pixel P is based on the cosine of
its distance in radians:
red = 125 + 125*cos( redCycles*radians );
Use similar formulas for green and blue. The command line for the program specifies the name and size of the image, and the number of cycles for each of red, green, and blue:
circles bullseye.ppm 300 300 redCycles greenCycles blueCycles
Here is a sample image:
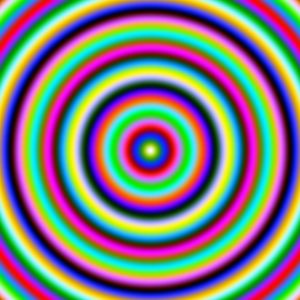 |
| Circular Cosines |
Easy variations: rather than have the distance in radians depend on the linear distance from the origin, you can make it depend on the log of the distance from the origin. Or you can use crazy variations of the distance formula to get interesting effects. Here is one (using the log of the squared distance):
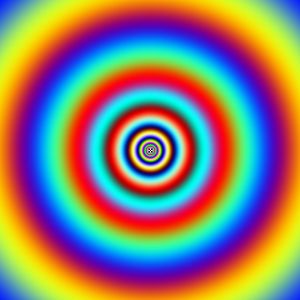 |
| Circles with Crazy Distance Function |
![]()
[M-15]
Write a program that creates an image
based on cosine waves (as above)
but now the cosine depends on the radial distance from the
center of the image plus the angle in radians of the line through the pixel.
For any pixel, think of it as lying on a line segment that starts at the center of the image. Measure distance along the line in radians from 0 to 2*PI, where distance zero is the origin and distance 2*PI is the distance from the origin to a corner. Now add the counter-clockwise angle of the line to the distance measure.
For instance, in the diagram, pixel P lies on a line segment that starts at the center of the image and ends on a circle who's radius is half the diagonal size of the image. The distance of pixel P from the center, measured in radians, is
radians = 2*M_PI*(dist/radius)
where dist
and radius are as in the previous puzzle.
To this add the angle from the x-axis to the line
(theta, in the diagram):
radians = 2*M_PI*(dist/radius) + theta
Adding theta into the distance in radians means
that the locus of a constant value of radians lies on a spiral.
For example, here is a diagram that shows the pixels that correspond
to the value 2*pi:
At point A the radial distance is 2*pi since A is the
maximum distance from the origin.
(Point A will not actually appear in the image.)
At point B the counter-clockwise angle is pi, so the distance
of B from the origin is half the maximum (pi, in radians).
And at point C the counter-clockwise angle is 2*pi, so the distance
is zero.
The counter-clockwise angle in radians is calculated using the math library's
arc tangent function atan2() and the distance of the pixel
from the origin measured in pixels:
theta = atan2( (c-cntC), (r-cntR) );
where (c,r) is the column and row of the pixel, and
(cntC, cntR) is the center of the image (in pixels).
The amount of red for pixel P is based on the cosine of
this modified distance in radians:
red = 125 + 125*cos( radians );
Use similar formulas for green and blue. The command line for the program specifies the name and size of the image: Here
spiral spiral.ppm 300 300
Here is an output image:
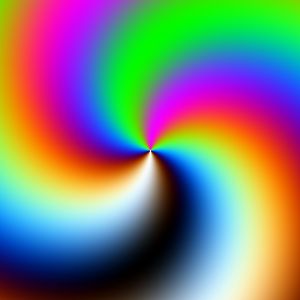
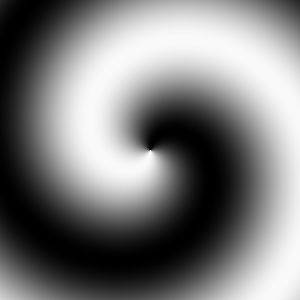 |
| Simple Spiral |
Since red, green, and blue all depend on the same angle, they will all have the same value, and the image will be shades of gray. For a colorful image, play around with ways to compute different radians for each color. (See the next puzzle.) Another thing to do is to calculate one of the colors with sin, not cos.
![]()
[M-15]
Write a program that creates an image
based on cosine waves that depend on the radial distance from the
center of the image plus the angle in radians of the line through the pixel.
As in the previous puzzle,
each pixel P corresponds to a value in radians from 0 to 2*pi.
The locus of a constant radian value is a spiral.
To create colorful spirals, let the user specify how many cycles the cosine waves should go through as the radians change from 2 to 2*pi. For example,
red = 125 + 125*cos( redCycles*radians );
where redCycles is the number of cycles for red.
Use similar formulas for the other colors.
(You may already have thought of this while playing with the
previous puzzle.
The command line should look like:
colorSpiral spiral.ppm 300 300 redCycles greenCycles blueCycles
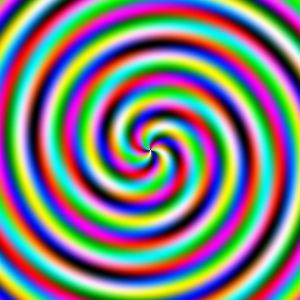
Here is a sample image:
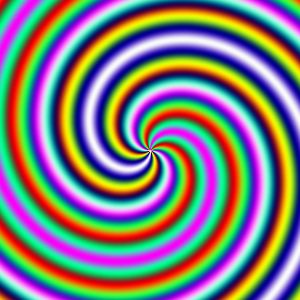 |
| Color Spiral |
Note that the number of red cycles is the number of times red goes through a complete cycle as the radial distance changes from zero to two pi. In the above image, red goes through eight cycles from the center (zero radians) to any corner (two pi radians). Since red is mixed in with the other colors, these cycles are hard to count.
The spiral, however, goes through just one cycle as it twists from zero to two pi. See the next puzzle for more on this.
![]()
[M-15]
Write a program based on the previous puzzle,
where now the counter-clockwise angle
is multiplied by a different number of cycles for red, green, and blue.
This value is added to the radial value of radians like this:
radians = 2*M_PI*(dist/radius) + theta*spiralRedCycles
As before, radius is the maximum diagonal distance from the
center of the image, dist is the distance of a pixel from the
center (calculated with the Pythagorean formula), and theta
is the counter-clockwise angle (calculated using atan2.
The command line for the program looks like:
cycleSpiral spiral.ppm 300 300 spiralRedCycles spiralGreenCycles spiralBlueCycles
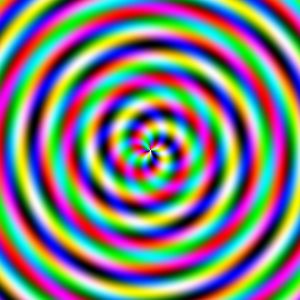
Here is a sample image:
 |
| Color Spiral |
![]()
[M-15]
Write a program based on the previous puzzles,
where now the counter-clockwise angle
is multiplied by a different number of cycles for red, green, and blue,
and the radial distance (measured in radians)
is multiplied by a different number of cycles.
For instance, for red
radians = 2*M_PI*(dist/radius)*radiusRedCycles + theta*spiralRedCycles
As before, the value for red at a pixel is calculated by first calculating the radian value for the pixel, and then calculating the color value from that:
red = 125 + 125*cos( redCycles*radians );
The command line now has six parameters for cycles:
spiralBoth spiral.ppm 300 300 radRed radGreen radBlue ccRed ccGreen ccBlue
where radRed is the number of cycles red goes through along a radius from
the center to a corner of the image (and similarly for green and blue),
and ccRed is the number of cycles red goes through as the radius that
connects the pixel to the center moves through angles 0 to two pi and similarly for green and blue).
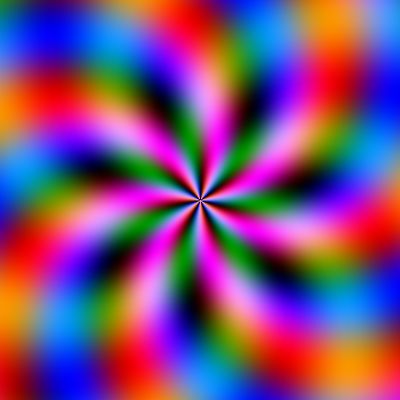
Here is a sample image
 |
| Many Cycles Color Spiral |
If the number of cycles is made negative for one of the counter-clockwise angles, the spiral will twist in the opposite direction. Here is an example of that (using this same program, with different parameters):
 |
| Many Cycles Color Spiral |
![]()
[M-15]
Start with one of the above programs but change the distance function
(which has been used to calculate dist)
to something else,
perhaps the log of dist or some power of dist.
There are other crazy things you can do.
Here is a sample image:
 |
| Crazy Spirals |
There is no solution given, since, unfortunately, I can't remember what I did to get this image.
[M-15]
Write a program that creates an image where the brightness values are
based on a function of x and y.
The function is something like:
double fun( double x, double y)
{
  return x*y;
}
Here is a sample image, based on the above function.
The values of x are -1 to +1, and the values of y are -1 to +1.
The origin is in the center.
The brightest pixels are in the upper right and lower left
where x*y is +1.
The darkest pixels are in the upper left and lower right
where x*y is -1.
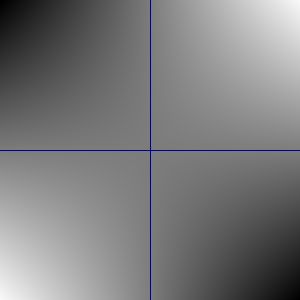 |
x*y, -1 <= x,y <= +1 |
The command line for the program is:
heightmap image.ppm nrows ncols minx maxx miny maxy
where
nrows
ncols give the size of the image.
minx and
maxx give the minimum values and maximum values of x.
miny and
maxy give the minimum values and maximum values of x.
You will need to translate row and column locations of pixels into x and y values. Do this with linear equations (like several already used in these puzzles):
      x = xmin + (xmax-xmin)*c/ncols;
      y = ymin + (ymax-ymin)*(nrows-r)/nrows;
You will also have to translate the minimum and maximum value that the function assumes over the image into the minimum gray level (zero) and maximum gray level (255). Do this with yet another linear equation. But to make it work, you will first need a first pass that finds the function's minimum and maximum value. A second pass generates the gray levels for the pixels.
You can plug in many other functions and see what images they
generate.
Here is an image for sin( x*x + y*y )/(x*x + y*y)
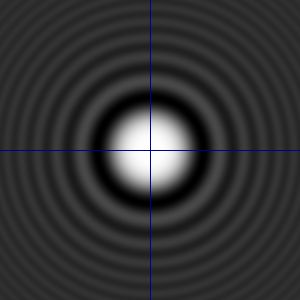 |
sin(x*x+y*y)/(x*x+y*y) |
You can map the values of the function to different colors than shades of gray.
Here is x*x, as above, but using a color look-up table for the pixel values:
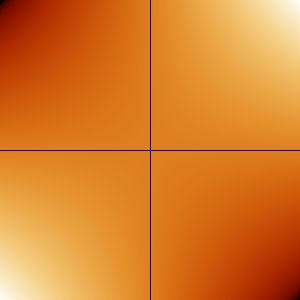 |
x*y, -1 <= x,y <= +1 |
![]()
The Mandelbrot set is a set of points (x,y) in the
2D plane that have a particular property.
In the picture below, the members of the set are colored black
and the rest of the 2D plane is green.
The left edge of the picture corresponds to x=-1.5
and the right edge of the picture corresponds to x=1.0.
The top edge of the picture corresponds to y=1.25
and the bottom edge of the picture corresponds to y=-1.25.
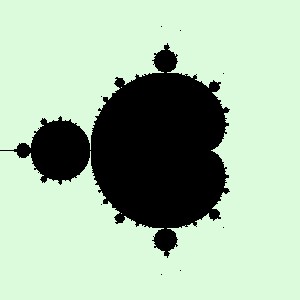 |
| Mandelbrot Set |
The particular property that determines if a point (x,y) belongs to
the set is the following.
(Skip this if you are not familiar with complex numbers;
look at the answer for the set function and go to the second half
of this puzzle):
(x,y)C1 = x+j*y, where j = sqrt( -1 )C2 = C12 + C1C3 = C22 + C1C4 = C32 + C1C5 = C42 + C1Ck = Ck-12 + C1Ck is greater than 4.0
(x,y) is NOT a member of the setk reaches some limit, say 800
(x,y) IS a member of the set
[H-25]
This is a somewhat complicated property.
Forget about images, for a while.
For a really good puzzle,
write a function that determines if
a point (x,y) is a member of
the set.
The prototype of the function is:
int MandelSetCount( double x, double y, int limit )
The function MandelSetCount()
keeps repeating
Ck = Ck-12 + C1
until either the limit is reached, or Ck2
is greater than 4.0.
The function returns the value k.
If k equals the limit, then the point is in the set.
![]() — Set Function
— Set Function
Write a program that uses the set function
and produces an image of the Mandelbrot Set.
Use the regions of the 2D plane given above (in the first paragraph).
For each pixel in the image,
translate its location (column, row)
into (x, y) and use set function to determine if the point
is in the set (and then color it appropriately).
Base your program on the 2D function view, puzzle I79.
A common variation of this program is to base the color
of a pixel on how many iterations
it took to decide that its corresponding (x, y)
is not in the set.
This is the count returned by MandelSetCount().
Translate the counts into colors with a look-up table or by other means.
![]() — Full Program
— Full Program
 ― Return to the main contents page